

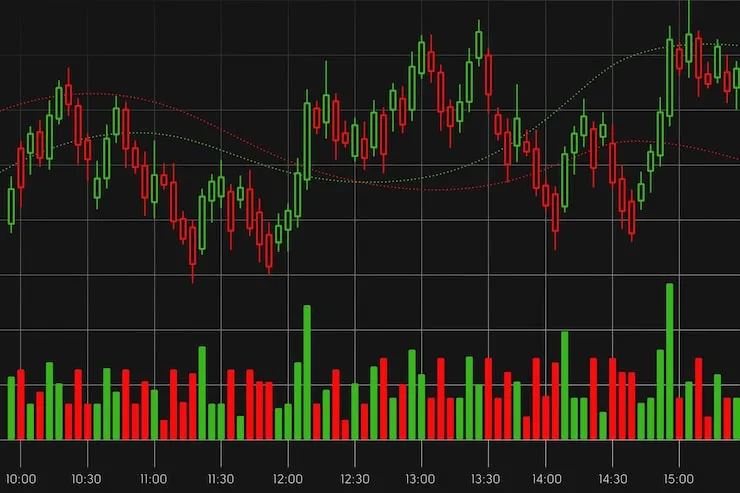
Prices on the screen move up and down every single day. Learning stock market chart analysis helps you make sense of these line movements quickly. Charts display past price action using small visual bars. By looking closely at these shapes, you can spot big trends easily. Money moves fast in public markets. Knowing how to read a simple price line gives you a clear edge. You do not need a math degree to understand the basics. A simple step-by-step look at simple chart movements helps build solid daily trading habits.
Understanding Basic Price Charts
Line charts show simple price paths over set time frames. Bar graphs add more detail like open and close prices. Most daily traders prefer green and red candle shapes instead. Green candles show price gains while red ones show price drops. Each shape tells a clear story about buying pressure. Reading these visual clues takes a bit of time at first. You will soon spot daily price shifts without stress. Simple visual tracking keeps your trading decisions clean and fast every single week.
Spotting Trends and Movements
Prices move in three basic ways across your screen. Upward trends show higher peaks over time. Downward paths show lower valleys as prices fall. Side movements happen when prices stay inside a flat box. Finding the main directional trend early keeps you safe. Following the main price path is usually a smart choice. Trying to pick precise market tops often leads to fast losses. Stick with the visible price path to make smart trades consistently without taking big risks.
Finding Support and Resistance
Support acts like a hard floor under moving prices. Prices bounce up after hitting this low level. Resistance works just like a low ceiling above price action. Prices often fall back down after touching this upper limit. Traders use these clear boundaries to plan safe market moves. Buying near support levels reduces your downside risks. Selling near resistance zones helps you lock in quick gains. These invisible boundary lines appear repeatedly on almost every trading chart you review daily.
Using Basic Technical Indicators
Moving averages smooth out choppy price lines for easy viewing. The basic technical analysis stock trading for beginner approach focuses on simple moving tools. Moving averages reveal the main trend by averaging past prices. Relative strength tools show if prices moved up too fast. Volume bars at the bottom show trading activity levels. High volume confirms strong price movements across all markets. Using just two basic indicators keeps your chart layout clean and easy to read during busy market hours.
Recognizing Common Chart Patterns
Price shapes repeat often because trader habits rarely change. Double bottom patterns look like a bright letter W. This shape often signals a price turn upward soon. Head and shoulders patterns signal a potential downward price drop. Triangle shapes show price squeezes before big price breakouts. Learning these visual shapes helps you plan better entry points. Patterns do not work every time, but they offer strong hints. Watching patterns form gives you time to plan smart trades safely.
Managing Trading Risk Wisely
Risk control protects your cash balance from big market drops. Always set a simple stop-loss level before entering trades. A stop order closes your trade if prices drop too low. Never risk more than two percent on a single idea. Position size matters much more than picking winning stocks every time. Keep your trade losses small to stay active long term. Safe trading requires strict discipline every single day. Protecting your capital allows you to trade comfortably without constant worry.
Conclusion
Mastering price movement takes consistent daily practice and real patience. Focus on simple charts, key support lines, and basic indicators first. Keeping your strategies simple usually leads to much better trading results. Avoid using too many technical tools at the same time. Track your progress daily by keeping a detailed trading journal. You can learn more insightful financial guides on finec.in to improve your daily skills. Stay patient, follow your risk plan, and build your trading knowledge steadily over time.